September Sales Stats – Dane County & Verona
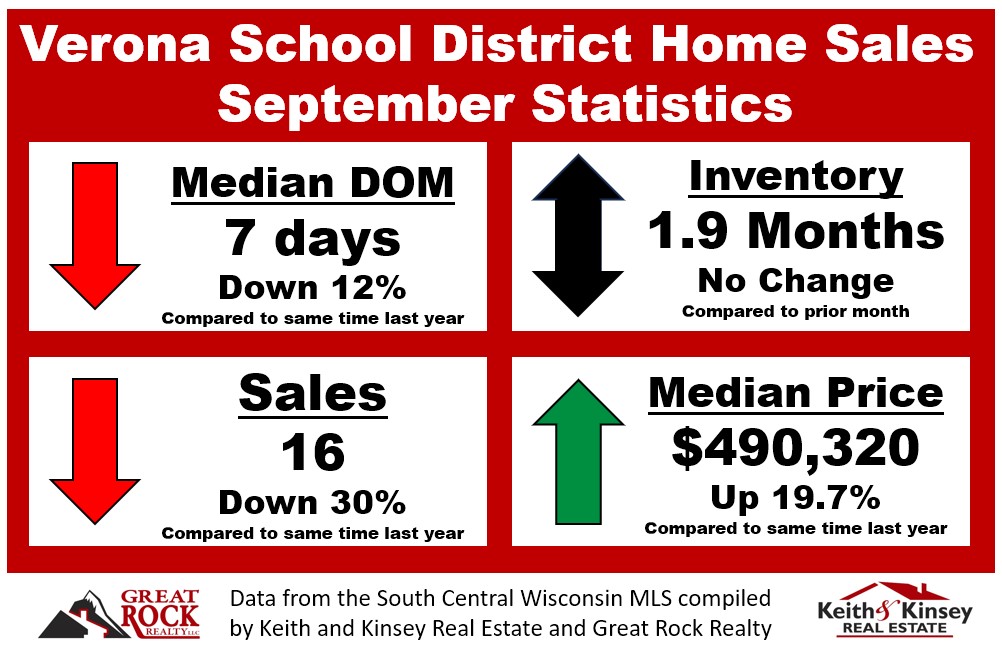
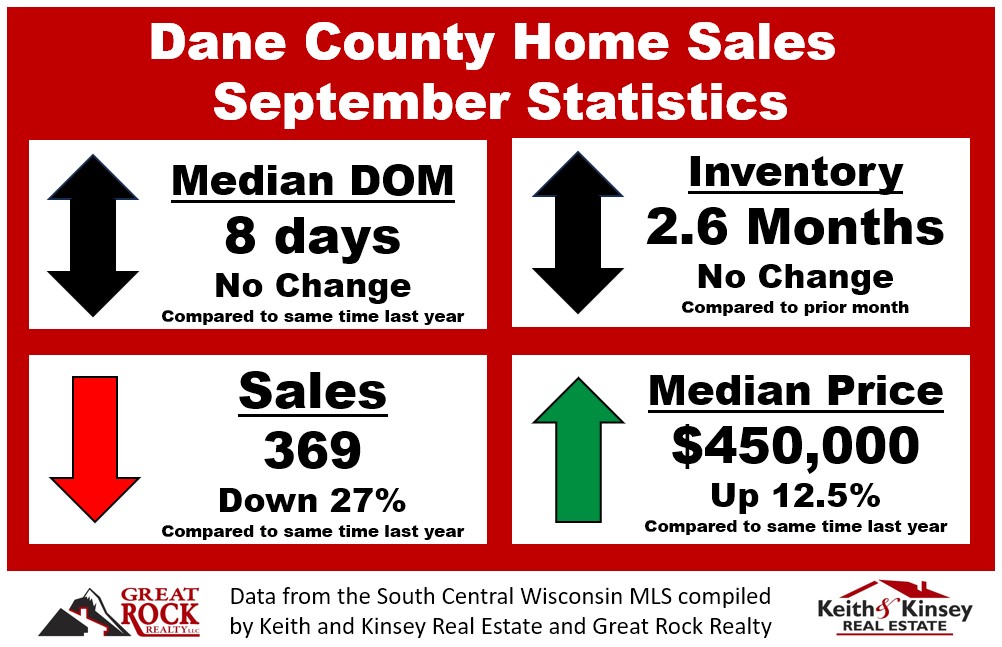
We are in the slower fall season of real estate with only 16 sales in Verona in the month of September and 369 total sales in Dane County. The median days on market for homes closed in September was 7-8, which is still quite fast despite a significant calming in buyer activity. Remember this is lagging data from homes that probably went under contract in July or August. The days on market for homes that were active last month was 38-39 and this is now up to 48 days in Dane County and 50 days in Verona. We are also seeing a number of homes with price reductions. This is a clear sign of less buyer demand but also relatively normal for this time of year. Inventory is still low at 1.9 months in Verona and 2.6 months across Dane County. We are not seeing many sales in the 20k-100k above asking price range anymore as we did this Spring and Summer. We still need inventory to increase in order to sway sales into the buyer’s favor, but I think now through Christmas will be your best buying opportunity with minimal competition. The ideal scenario might be for a home owner to upgrade by putting a home under contract in November or December with a closing in January or February and selling their current home in March or April when demand really ramps back up. This way you could take advantage of buying in the slow season and selling in the hot season with only a few weeks of overlap.
| Sale Date | Address | # Bed | # Bath | Year Built | Days on Mkt | Sq Ft | Price/SF | List Price | Sale Price |
| 9/12/2023 | 2507 Spark Street | 3 | 2.5 | 2023 | 29 | 1,525 | $272.07 | $414,900 | $414,900 |
| 9/15/2023 | 2007 Shafer Drive | 4 | 3.5 | 1976 | 29 | 3,800 | $107.89 | $442,000 | $410,000 |
| 9/15/2023 | 744 Whalen Road | 4 | 3 | 1991 | 5 | 2,565 | $189.86 | $474,900 | $487,000 |
| 9/15/2023 | 404 Blackburn Bay Drive | 3 | 2 | 2018 | 4 | 1,572 | $318.07 | $474,900 | $500,000 |
| 9/15/2023 | 1019 Hillside Circle | 4 | 2.5 | 2006 | 29 | 3,328 | $186.30 | $649,900 | $620,000 |
| 9/18/2023 | 1245 Merry Blossom Lane | 3 | 2 | 2023 | 0 | 1,584 | $311.64 | $493,640 | $493,640 |
| 9/18/2023 | 2645 Richardson Street | 3 | 2.5 | 1984 | 4 | 1,766 | $285.96 | $449,900 | $505,000 |
| 9/18/2023 | 2100 Davis Hills Drive | 3 | 2 | 1981 | 40 | 2,088 | $263.41 | $550,000 | $550,000 |
| 9/20/2023 | 5707 Modernaire Street | 4 | 3 | 1980 | 3 | 2,712 | $202.80 | $542,000 | $550,000 |
| 9/25/2023 | 1060 Magic Meadow Court | 4 | 2.5 | 2020 | 11 | 2,211 | $251.88 | $556,900 | $556,900 |
| 9/26/2023 | 2508 Spark Street | 3 | 2.5 | 2023 | 0 | 1,737 | $229.07 | $397,900 | $397,900 |
| 9/26/2023 | 2512 Spark Street | 3 | 2.5 | 2023 | 12 | 1,737 | $229.07 | $397,900 | $397,900 |
| 9/27/2023 | 1282 Merry Blossom Lane | 3 | 2.5 | 2023 | 0 | 1,526 | $274.15 | $418,358 | $418,358 |
| 9/29/2023 | 845 Kimball Lane | 4 | 2.5 | 2007 | 5 | 1,770 | $200.56 | $349,900 | $355,000 |
| 9/29/2023 | 2725 Spark Street | 3 | 2.5 | 2021 | 6 | 1,615 | $256.97 | $415,000 | $415,000 |
| 9/29/2023 | 1271 Cathedral Point Drive | 4 | 3.5 | 2012 | 11 | 2,604 | $240.02 | $649,900 | $625,000 |


 Back Home


