November Sales Stats – Dane County & Verona
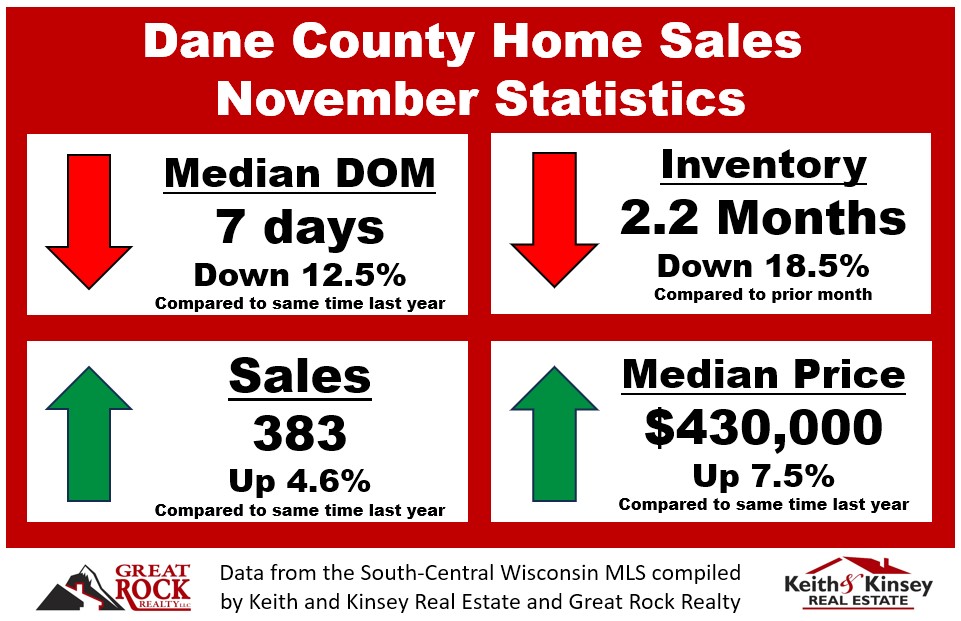
There’s some confusing data coming from the November sales statistics in Dane County. In October, it appeared that median prices had flattened (compared to the same month the prior year) and inventory was increasing. In November prices appear to be up 7.5% again, and inventory appears to be dropping again. That’s not great news if you are a buyer, but good if you are a seller. The good thing for buyers though is the number of homes with multiple offers is way down. I still think there’s a great opportunity to buy now without competition and then refinance later when interest rates are down further. My assumption is the dip in interest rates gave a little bit of a spike in sales which were up 4.6% over last November causing the increase in median price and reduced inventory. I think the Fed is going to need to be careful about pulling back interest rates or we’ll see another housing market surge again. There is still a lot of pent up demand, especially in the under $450,000 price range.
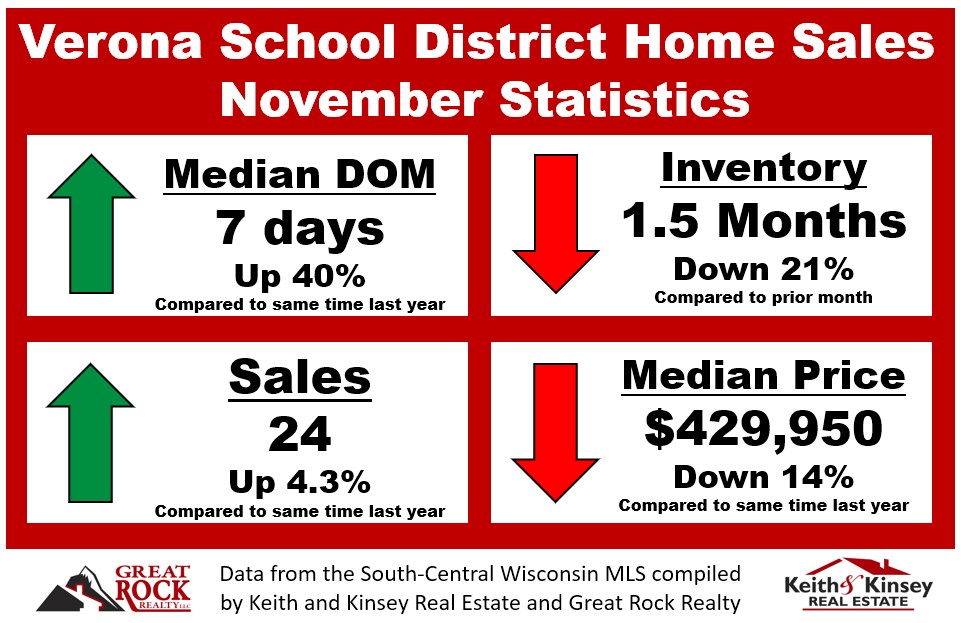
Verona stats are also a bit confusing. These also show an increase in sales and drop in inventory. However, the alarming thing is the big dip in Median price for November. Why is so different than the county average you ask? Well I dug a little further… the average price per square foot in Verona is actually up 7.2% over last November, which is on par with the county wide price jumps. So a similar house is still selling for more than last November. However, we are seeing fewer higher end homes selling. Of the active homes on the market in the Verona school district 72% are above the median price sales price and the median days on market for those active listings is up to 65 days. Additionally 57% of the pending sales are below the median price. There is clearly way more demand in the starter home price ranges right now. A first time buyer, just wants a house and cares less about the interest rates. A buyer upgrading in house will be less likely to give up there 3% rate to move to a bigger home.
Here’s the November sales in the Verona Area School District:
| 11/10/2023 | 2537 Mutchler Road | 3 | 1 | 1920 | 6 | 1,491 | $205.23 | $294,500 | $306,000 |
| 11/17/2023 | 738 Schubert Street | 3 | 2.5 | 2007 | 3 | 1,206 | $257.05 | $305,000 | $310,000 |
| 11/9/2023 | 409 Westlawn Avenue | 2 | 1 | 1950 | 6 | 1,235 | $277.73 | $289,900 | $343,000 |
| 11/20/2023 | 2636 S Norfolk Circle | 3 | 2 | 1979 | 40 | 2,008 | $187.75 | $380,000 | $377,000 |
| 11/30/2023 | 1999 Shafer Drive | 3 | 2 | 1985 | 10 | 1,600 | $240.63 | $389,000 | $385,000 |
| 11/27/2023 | 824 Maple Road | 3 | 1.5 | 1989 | 8 | 1,680 | $229.17 | $349,900 | $385,000 |
| 11/10/2023 | 5820 Monticello Way | 4 | 2 | 1976 | 6 | 2,220 | $184.68 | $410,000 | $410,000 |
| 11/20/2023 | 1649 County Road PB | 4 | 3 | 2014 | 5 | 2,260 | $184.07 | $410,000 | $416,000 |
| 11/8/2023 | 2485 WILDCAT Drive | 3 | 2.5 | 2023 | 54 | 1,615 | $266.19 | $429,900 | $429,900 |
| 11/22/2023 | 3009 Prairie Road | 3 | 3.5 | 1990 | 73 | 2,206 | $194.92 | $439,000 | $430,000 |
| 11/15/2023 | 1244 Merry Blossom Lane | 3 | 2.5 | 2023 | 0 | 1,510 | $286.66 | $432,858 | $432,858 |
| 11/15/2023 | 1276 MERRY BLOSSOM Lane | 3 | 2.5 | 2023 | 74 | 1,615 | $275.48 | $444,900 | $444,900 |
| 11/9/2023 | 306 N Nine Mound Road | 4 | 3 | 1988 | 6 | 2,124 | $218.93 | $435,000 | $465,000 |
| 11/6/2023 | 319 Thompson Street | 3 | 2 | 1981 | 15 | 2,359 | $211.95 | $499,900 | $500,000 |
| 11/6/2023 | 1275 MERRY BLOSSOM Lane | 3 | 2.5 | 2023 | 0 | 2,086 | $245.59 | $512,293 | $512,293 |
| 11/28/2023 | 6712 Red Stone Lane | 3 | 2 | 1974 | 11 | 1,560 | $346.15 | $575,000 | $540,000 |
| 11/17/2023 | 1008 Zingg Drive | 5 | 3 | 2001 | 7 | 2,516 | $218.60 | $550,000 | $550,000 |
| 11/13/2023 | 583 E Chapel Royal Drive | 4 | 2.5 | 2019 | 12 | 3,043 | $220.14 | $669,900 | $669,900 |


 Back Home


Leave a Reply
You must be logged in to post a comment.